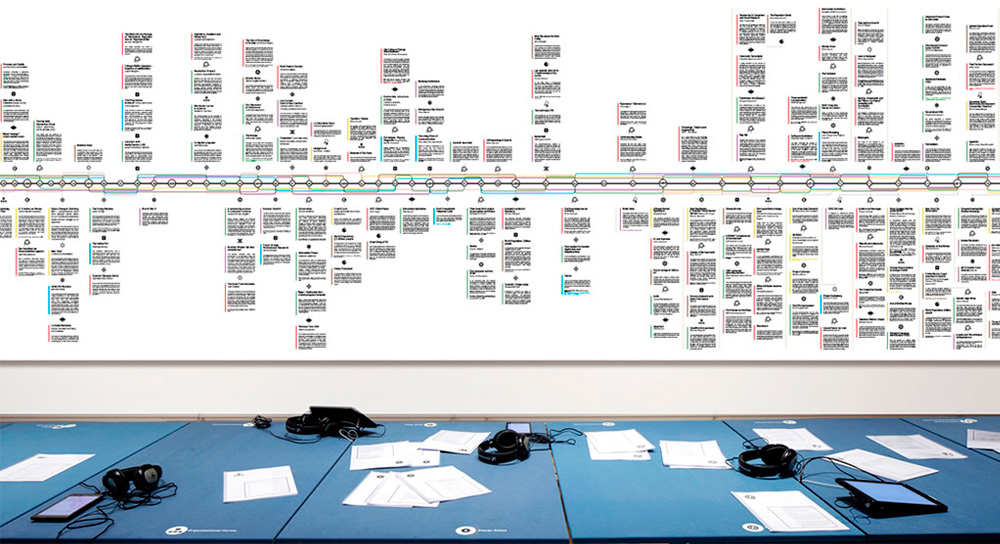
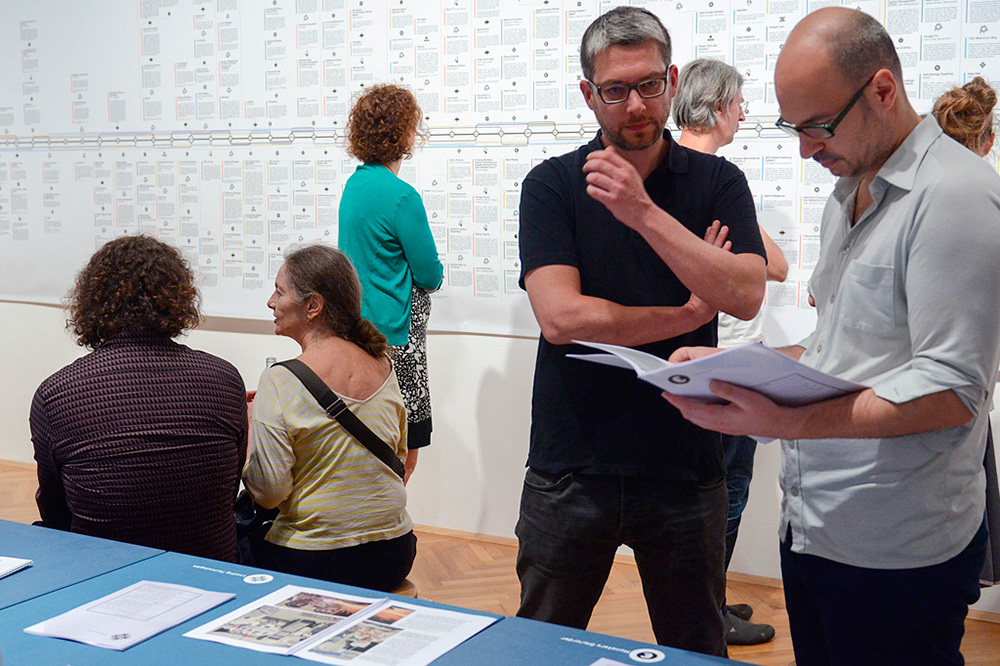
The graphic representation of the entire timeline is the most prominent visual aspect of the project. In its current version, it contains 471 entries in six horizonzal categories and 12 vertical tags and it measures 11 x 1.5 meters. The format has been chosen to allow a view of the entire timeline at once, which is both overwhelming in its dimensions and surprisingly coherent visually. This immediately opens to the central question of the project: What are the upsides and the downsides of providing an comprehensive framework to represent large-scale historical developments?
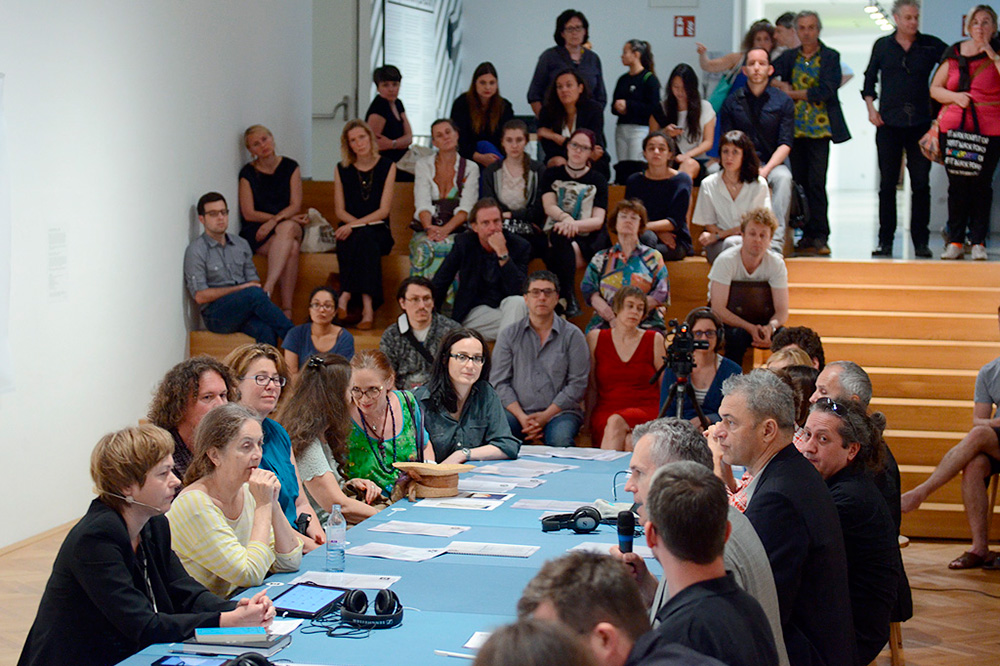
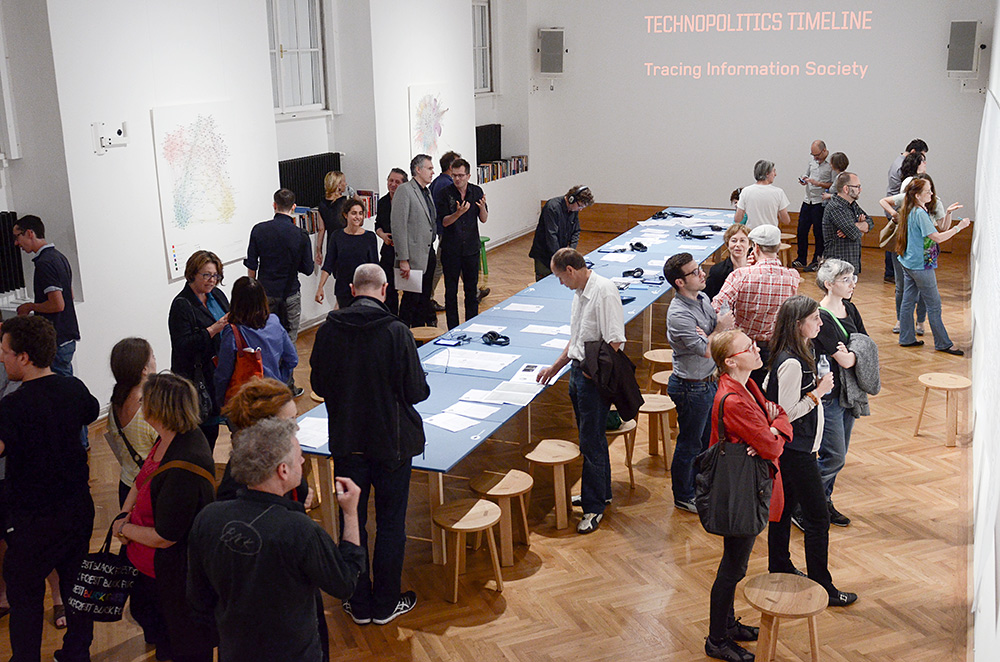
It is important to us that such questions, which need to be debated and cannot be settled, are raised in a physical space in the copresence of other people. It is the main value of the timeline that it generates questions and debates on the spot.
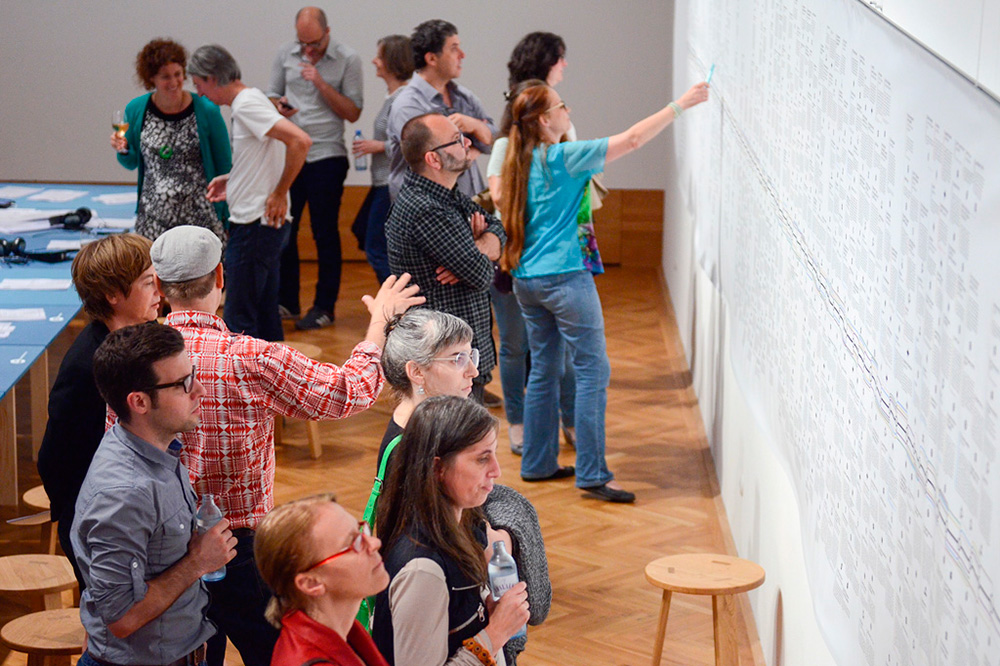
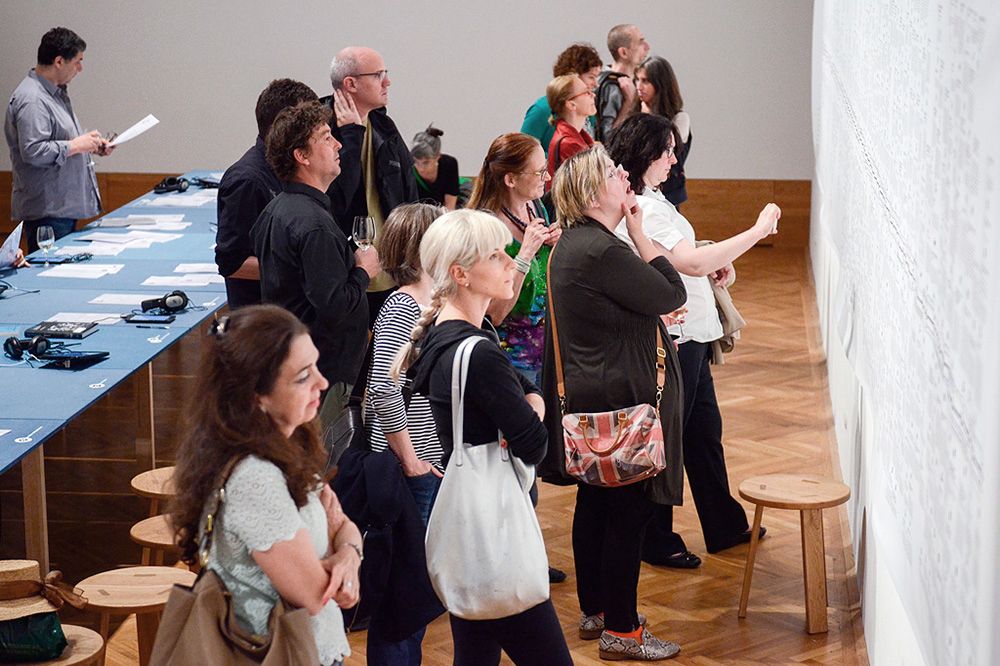
While the first impression of the printed timeline encompasses a timeframe of nearly 120 years, the actual interaction happens when people draw nearer and thus move from a seemingly totalizing overview to details and facts: People start pointing, gesturing, talking by developing and discussing individual narrative threads.
We noticed that many people start their exploration of the timeline — which, despite its linear chronological order, is never read linearly — with their own year of birth. While we did not plan for this, we think it's the perfect starting point, since it immediately raises the question of the relationship between different scales: the micro-scale on which we live out our singular lifes, and the macro-scale of historical transformation.
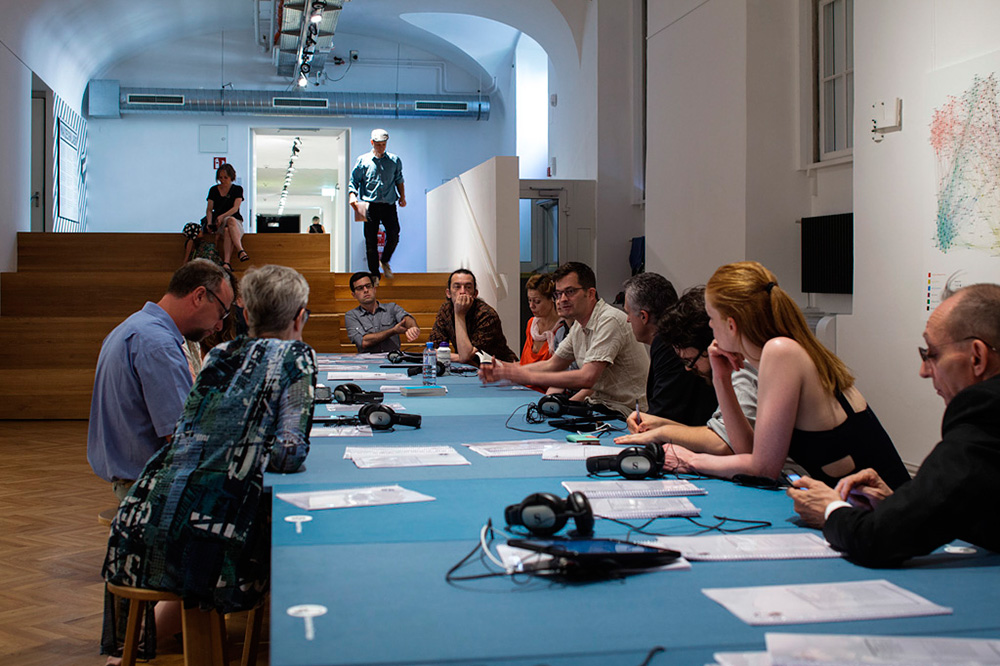
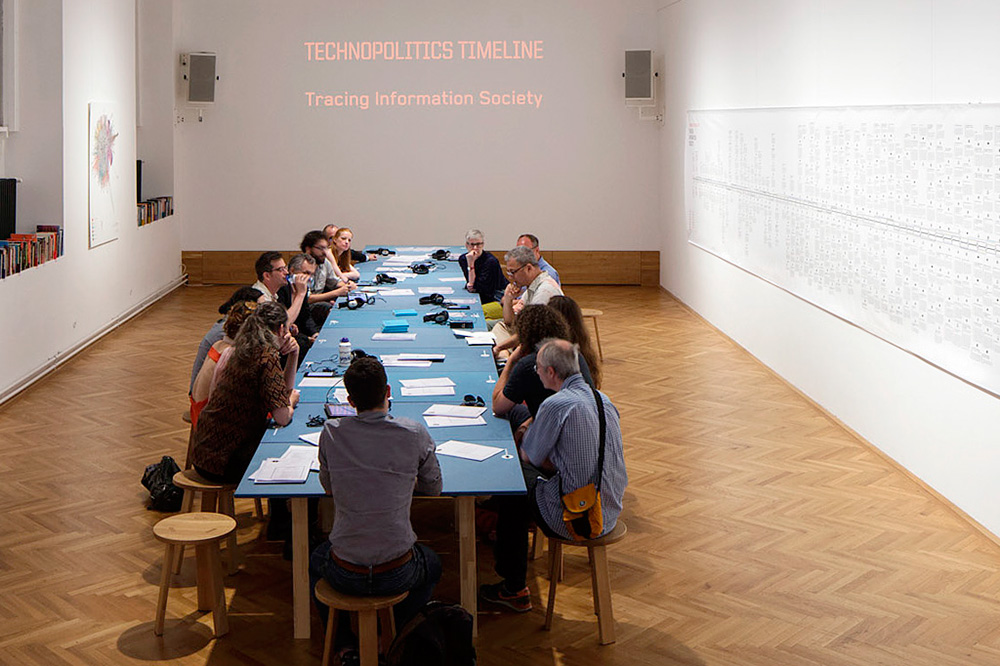
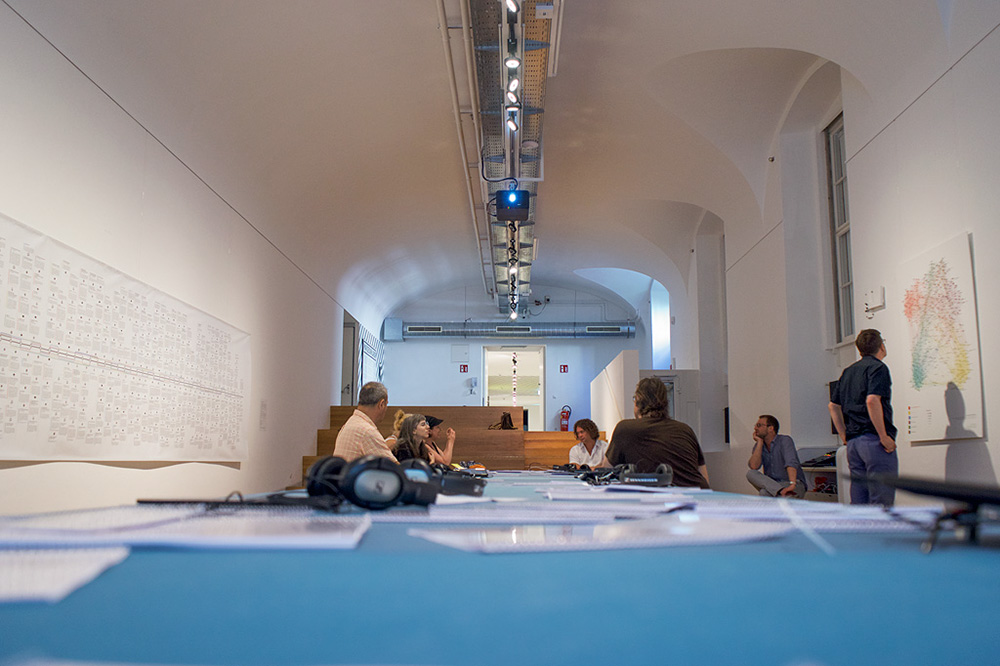
The second major material element of the project is a long table. In its current version, it consists of 12 plates, each devoted to one of the vertical tags that are also represented on the timeline.
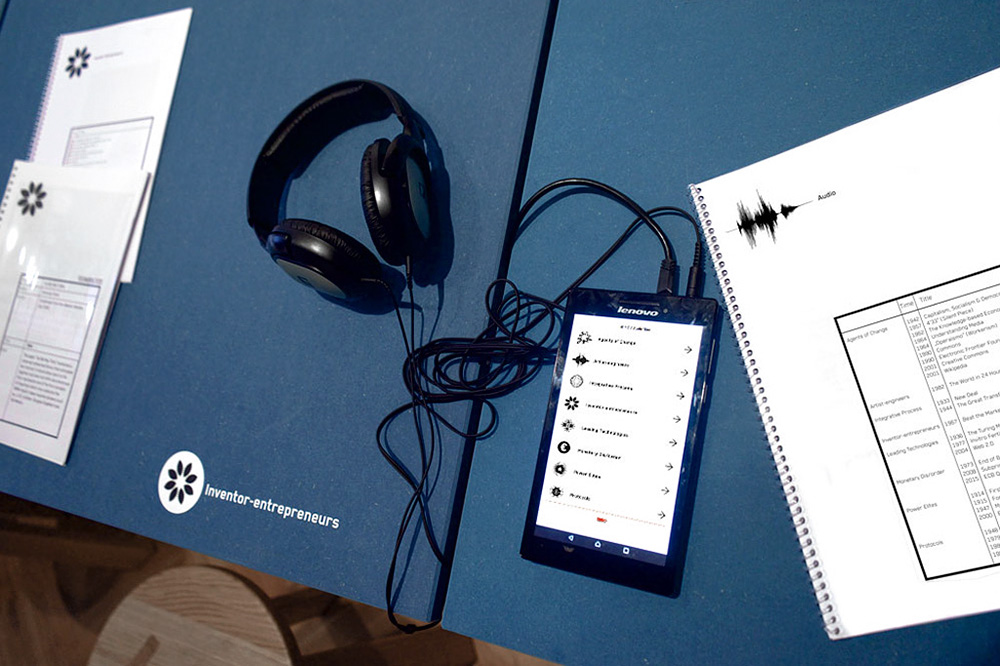
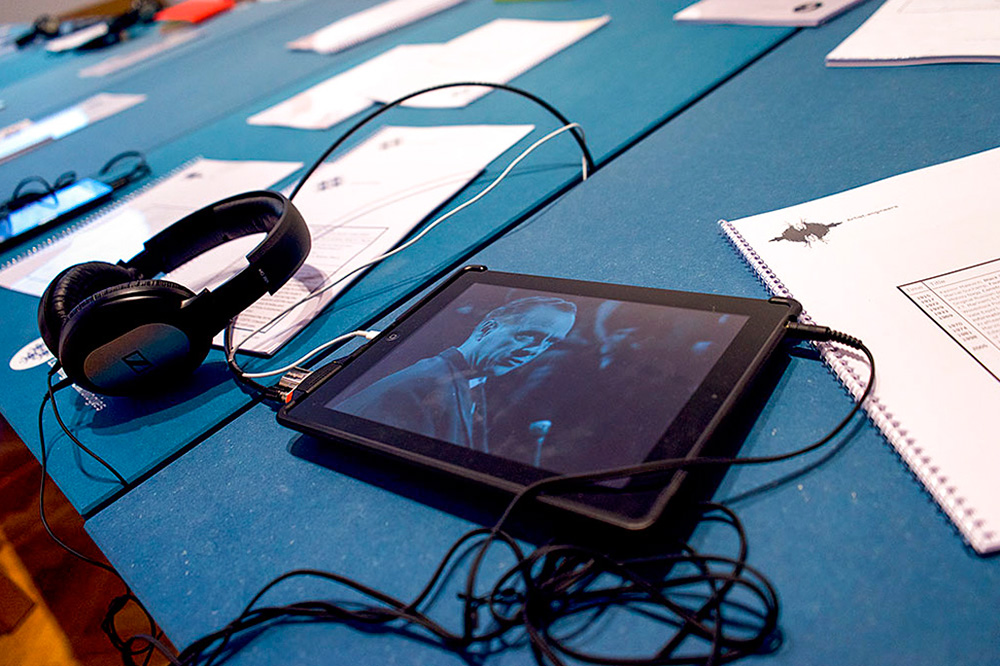
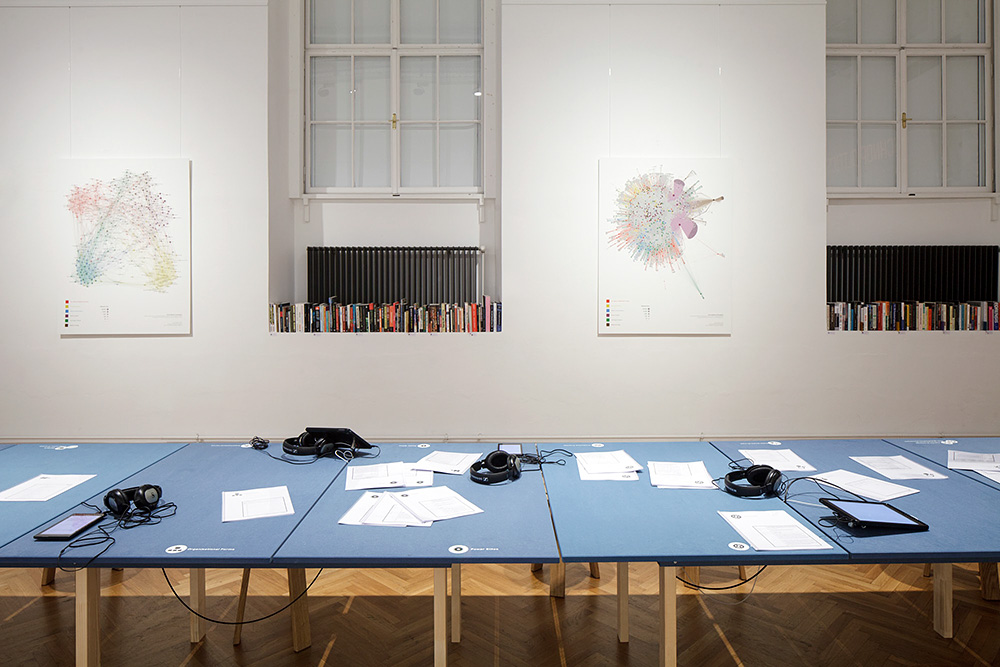
On the table is material for each category that enables a deeper interaction with the entries of the timeline.
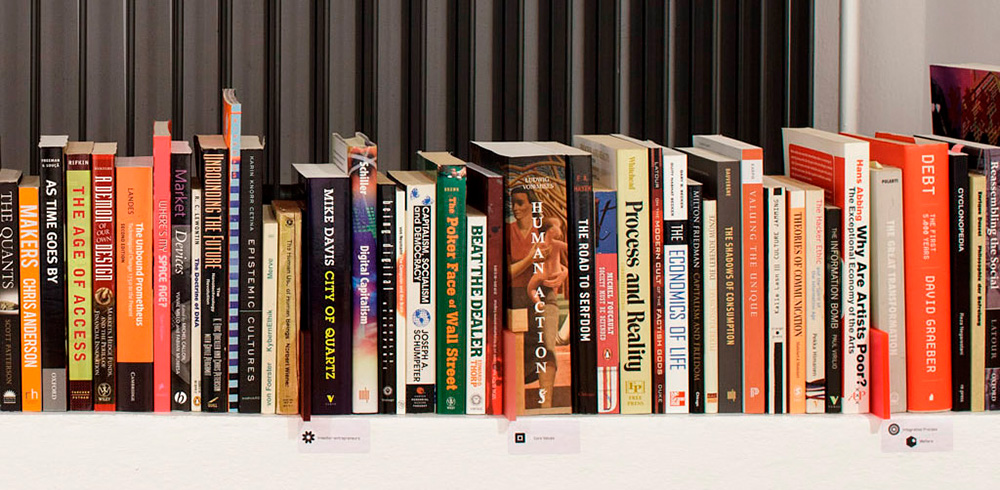
In the recent presentation at the MAK Forum, a number of iPads/Tablets were used to display audio and video materials curated by the group. Special booklets were printed with collections of texts and images. Books were displayed separately on a shelf. In a special collaboration with Oe1, the science and culture program of the Austrian radio corporation, excerpts of radio programs were presented on tablets. Between 3 to 10 minutes long, the pieces explain contents and contexts, such the origin of the knowledge economy or McLuhan.
All the material refers closely to the entries on the Timeline.
Ordering system
The ordering system according to "tags" enables to break free from the strict chronology of the timeline, and thus allows for other relationships between the entries to emerge.
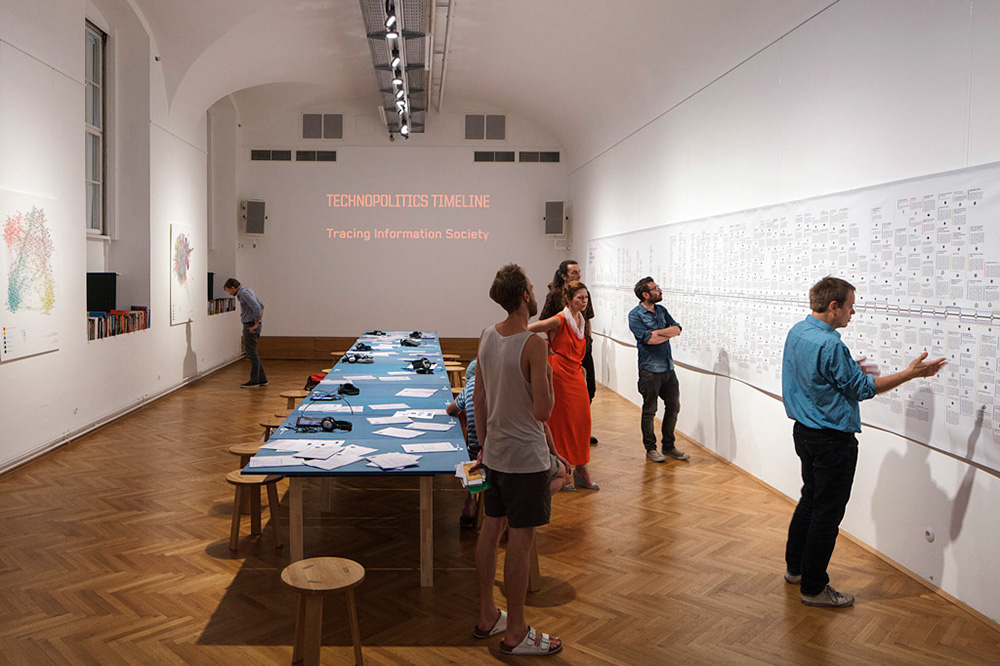
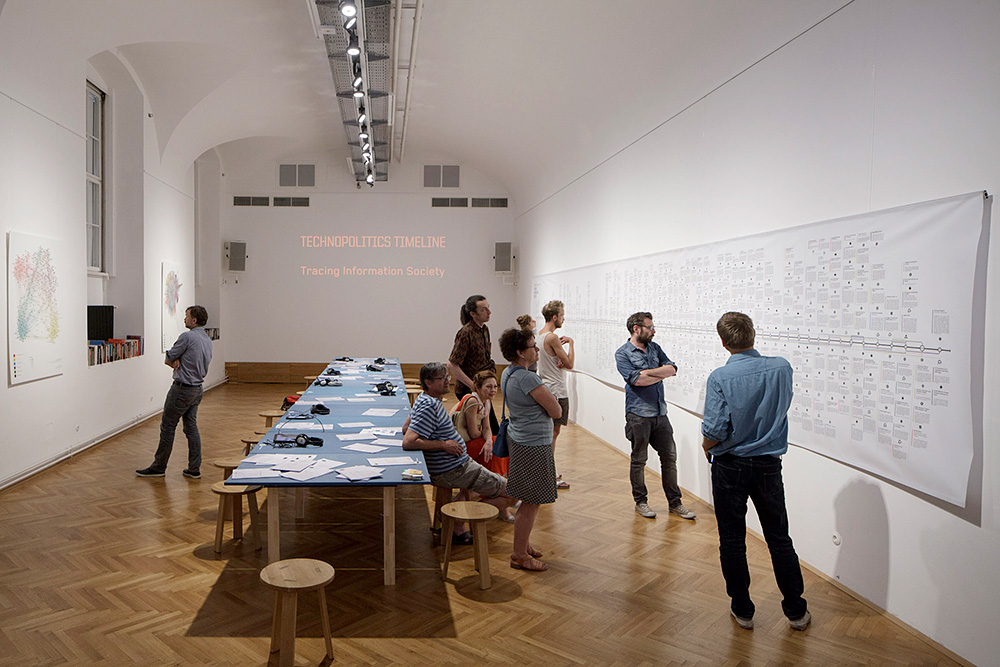
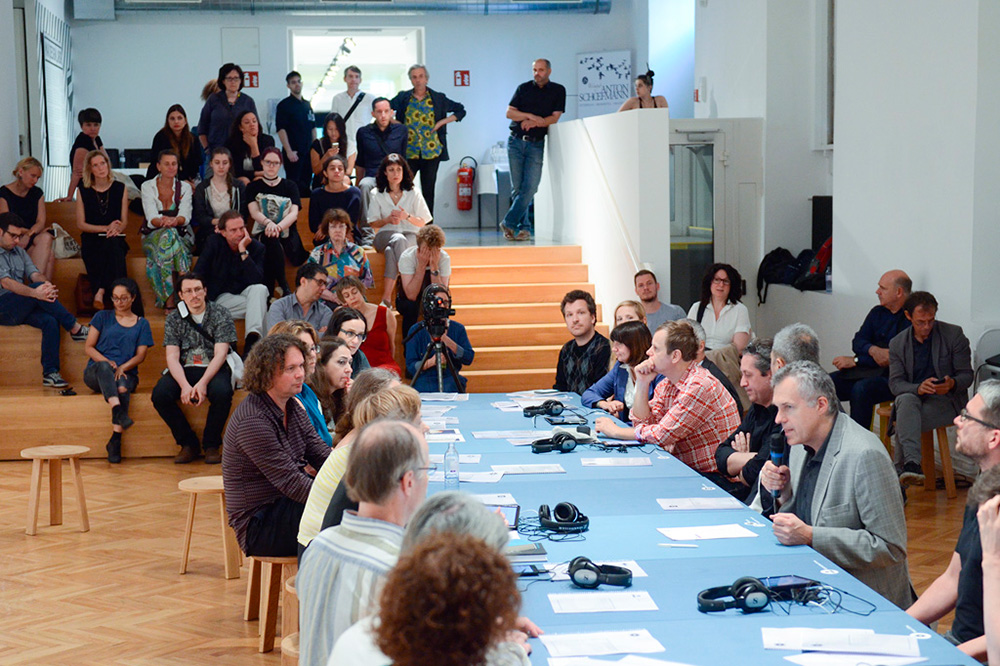
The table serves several functions: It is a space of individual study where visitors can delve into certain issues and it serves as a site for workshops, discussions and other forms of open interaction.
The table is also symbolically important as a "round table" that brings people together.
Conversational piece
The timeline is a conversational piece, and among the most frequent questions that start the conversation are:
- Why is x (not) included?
- Do entries that are clustered in one year have more in common than the date?
- In other words, are there any deeper, structural dynamics that could serve as a causation for this co-presence?
- Or is it just a coincidence?
- If you can provide such an overview of the information society, isn't that an indication that it's already over?
- What comes afterwards?
These are very valid questions that provide entries into the project and advance its central aim to develop a deeper, open exploration of situating ourselves within the historical process.
The first question concerns the timeline itself, the basic assumptions that guide the processes of selection and the possible biases that this reveals. It's an unavoidable question. Not only because the timeline comprises a finite number of entries but because we find the question productive both for the continuing processes of expanding/revising the timeline as well as for people to relate their individual knowledge domains to the larger analysis.
The second question reorients the view away from the dates and events, the format of the timeline, to more continuous processes and slow transformations, thus overcoming some of the limitations of the timeline. Since the co-presence of the events on the timeline has not been strictly planned according to a coherent underlying theory but stems from the collective efforts that included multiple perspectives there is no set answer to this question, but it invites to associative exploration.
The third question points from the past to the present and the future. Are we at a point where one large-scale socio-economic paradigm is being replaced by another? If so, can we already detect the parameters of the new one? How do we relate to them? Can they be influenced? And how?
These are all open questions to which the timeline does not provide ready answers. However, it provides lots of structured material for further debates and explorations. This can be done through different conversational formats, such as guided tours through the timeline, workshops and lectures that expand on some of the questions and issues.
In many ways, these discursive elements are the core of the project.
Workshops
Visualizations
An additional layer is provided by network visualizations by Doron Goldfarb. His engagement with the data material from the Timeline allows new thinking and the discovery of gaps in a project such as this. Doron uses Wikidata — the database back bone structure of Wikipedia — to search for relations between terms. It is also possible to map where those terms link in the wider Wiki-Web. While the amount of data is exploding today, the visualizations can disclose structural issues that have to do with the representation of knowledge, not only on our Timeline but generally.
Technopolitics is a research platform composed of artists, theorists, computer scientists, and journalists, who jointly develop innovative formats at the intersection of art, research, science, and education.
John Barker, writer | Sylvia Eckermann, artist | Doron Goldfarb, computer scientist/author of the presented network visualisations | Armin Medosch, curator/art and media theorist | Gerald Nestler, artist/researcher | Felix Stalder, sociologist/cultural theorist | Axel Stockburger, artist/researcher | Gerald Straub, applied cultural theorist/curator/artist | Matthias Tarasiewicz, digital artist/RIAT research director | Thomas Thaler, science journalist | Ina Zwerger, science journalist, Ö1 | Timeline design: Fatih Aydogdu, artist/designer | Photos: Wolfgang Thaler, Andreas Diem